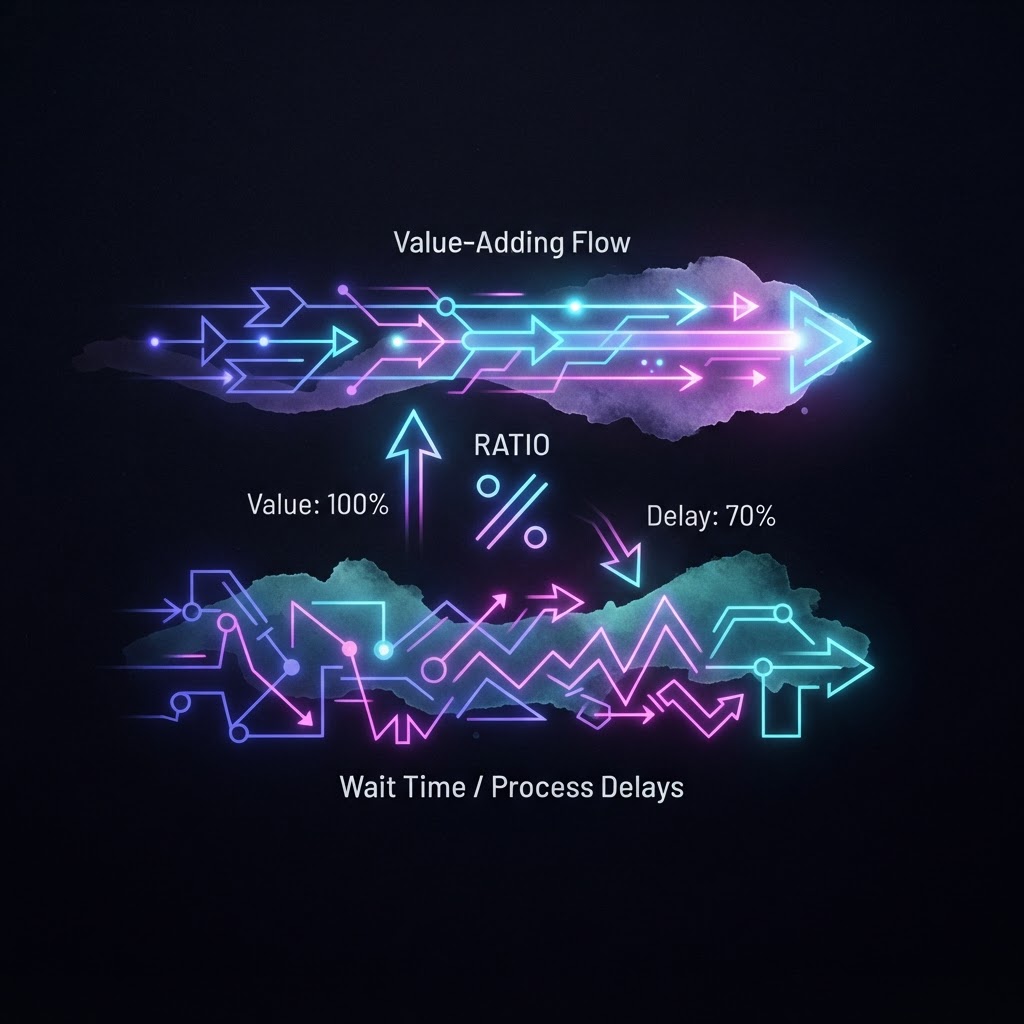
Tracking speed alone hides where time actually vanishes. Most operational pipelines resemble metropolitan traffic: teams feel like they are moving rapidly, yet individual initiatives spend eighty percent of their calendar lifecycle waiting for sign-offs, staging environments, or scheduling windows. Flow efficiency ratio strips away the illusion of busyness by dividing active working time by total elapsed duration.
Traditional management obsessively optimizes worker utilization, assuming that fully loaded calendars equate to peak organizational momentum. When utilization reaches capacity, queues compound exponentially, stalling the movement of actual customer value. Monitoring flow efficiency shifts the operational focus away from task activity and directly onto work item liquidity.
Modern operations rely on continuous delivery and automated orchestration to trim idle states between cross-functional teams. Prioritizing flow efficiency reveals whether throughput slowdowns stem from production friction or governance delays, allowing leaders to eliminate systemic holding patterns.
Industry case01
Act I: Liberating the Policy Underwriting Queue
Commercial Insurance · PMO
A commercial underwriter tracked eighteen days of lead time for middle-market risk submissions, yet actual actuarial analysis required barely six hours of hands-on labor. The PMO mapped each handoff across policy triage, rating calculation, and compliance clearance. The diagnostic uncovered that files spent over ninety-five percent of their lifecycle resting between inbox tiers and awaiting senior authority meetings. The PMO redesigned the sequence by embedding real-time rule clearance and pre-authorized underwriting criteria directly within the broker portal. Active working time remained steady at six hours, but the total elapsed processing duration dropped to two days.
Takeaway: Focus your improvements on queue waiting windows rather than attempting to accelerate active specialist labor.
Executive perspective02
Act II: The Blueprint for Operational Velocity
Enterprise Software · CxO
Our enterprise customer onboarding journey consumed seventy days, and our teams initially assumed implementation engineers lacked capacity. I directed the operations group to measure the ratio of active configuration hours against total calendar days. The flow efficiency was four percent, exposing that client initiatives spent weeks parked in legal terms verification, data lake credential requests, and multi-tenant firewall reviews. We restructured client delivery by converting manual sequential sign-offs into parallel digital handshakes and establishing automated sandbox provisioning. Implementation lead times fell to twenty-two days without adding head count.
Takeaway: Measure the calendar idle states between handoffs to expose the true operational friction across cross-functional workflows.
Before and after03
Act III: Transforming the Loan Disbursement Engine
Retail Banking · CPO
Personal loan approvals required fourteen business days, with files ping-ponging through six disconnected legacy departments. Manual income verification, credit committee reviews, and document auditing created extensive wait queues that kept customer applications idle for days. The operations team re-architected the journey with automated document parsing and programmatic risk thresholds, slashing approval handoffs to a single continuous stream. Loan turnaround condensed from fourteen days down to thirty minutes, elevating customer conversion rates while cutting administrative review expenses.
Takeaway: Replacing manual batch reviews with single-piece automated flow converts idle queue time into near-instantaneous business delivery.
Cautionary tale04
Act IV: The Trap of Local Resource Optimization
Medical Device Manufacturing · PMO
An engineering operations office sought to maximize documentation output by mandating that regulatory writers maintain ninety-eight percent calendar utilization. Writers operated at full capacity on dozens of simultaneous product submission files, generating deep backlogs at testing and certification phases. Because each specialist remained booked weeks ahead, simple cross-functional clarifications remained unanswered in queues for weeks. Cycle times expanded threefold, and overall compliance approvals slowed down despite record task numbers. The team restored system throughput by establishing strict work in progress caps and optimizing file flow instead of individual staff availability.
Takeaway: Maximizing individual worker utilization creates system congestion that degrades end-to-end operational throughput.